DataFrame
The DataFrame structure allows one to easily store related data, i.e. Vectors, in a column-indexed format where each column is linked with a descriptive String.
Structure
The DataFrame is really just a structure with two pointers, one to a Chain object and another to a Space.
typedef struct data_frame_t {

    Chain *chain;
    Space *space;

} DataFrame;
Hopefully these names aren't too confusing; A Chain is simply a linked list whose data are of type String, a Space is a linked list of Vectors who have the same size.
Construction
What's really awesome about libejovo is that we can use C's variadic functions to instantiate a Chain and Space quite easily. For example, imagine that we wanted to study how different distributions behave. We can generate samples of size n from a given distribution using the functions defined under the TYPED(Matrix_dist) submodule
 TYPED(Vector)*rnorm = TYPED(Vector_rnorm)(1000, 0, 1);    // 1000 samples of X ~ N(0, 1)
 TYPED(Vector)*runif = TYPED(Vector_runif)(1000, -10, 10); // 1000 samples of X ~ U(-10, 10)
 TYPED(Vector)*rexp  = TYPED(Vector_rexp) (1000, 3);     // 1000 samples of an exponential distribution with rate parameter `3`
We can easily wrap these three Vectors up into a Space in two different ways. Either we can manually add them one by one:
Space *root = newSpace(rnorm);
appendSpace(root, runif);
appendSpace(root, rexp);
Or, we can make use of variadic functions to instantiate a Space object in one line. To do so, we MUST pass the Vector count as the first argument of newSpaceVar:
Space *root_alt = newSpaceVar(3, rnorm, runif, rexp);
Here for example we indicate that there are 3 vector arguments. We can similarly create a new Chain object with newChainVar, passing const char* strings as arguments:
Chain *data_desc = newChainVar(3, "X ~ N(0 1)", "Y ~ U(-10 10)", "Z ~ exp(rate = 3)");
- Don't put commas in the names of your columns or you risk ruining the structural integrity of the comma-separated value format, as I've just learned from experience...
We can then unify the data into a DataFrame:
DataFrame *df = newDataFrame(data_desc, root_alt);
printDataFrame(df);

Exportation
Notice how there are 1000 observations, with 3 columns each. If we want to visualize this data set with a statistical software package, we can first convert to a comma-separated value file, .csv, using the function: writeCSV.
writeCSV(df, "df.csv");
The data will then be stored in the proper format to interface with other software suites.
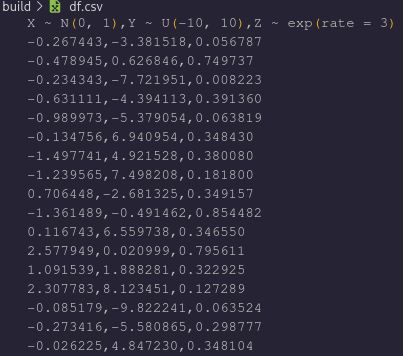
- Note: The data in this set differs from the previous image only because they were taken on successive executions and the RNG produces different experiments each time.
Renaming the variables and using the pivot_longer function in R (that I am not going to even try and compete with, btw) allows us to create the pretty graphic with ggplot2, visualizing the different distributions:
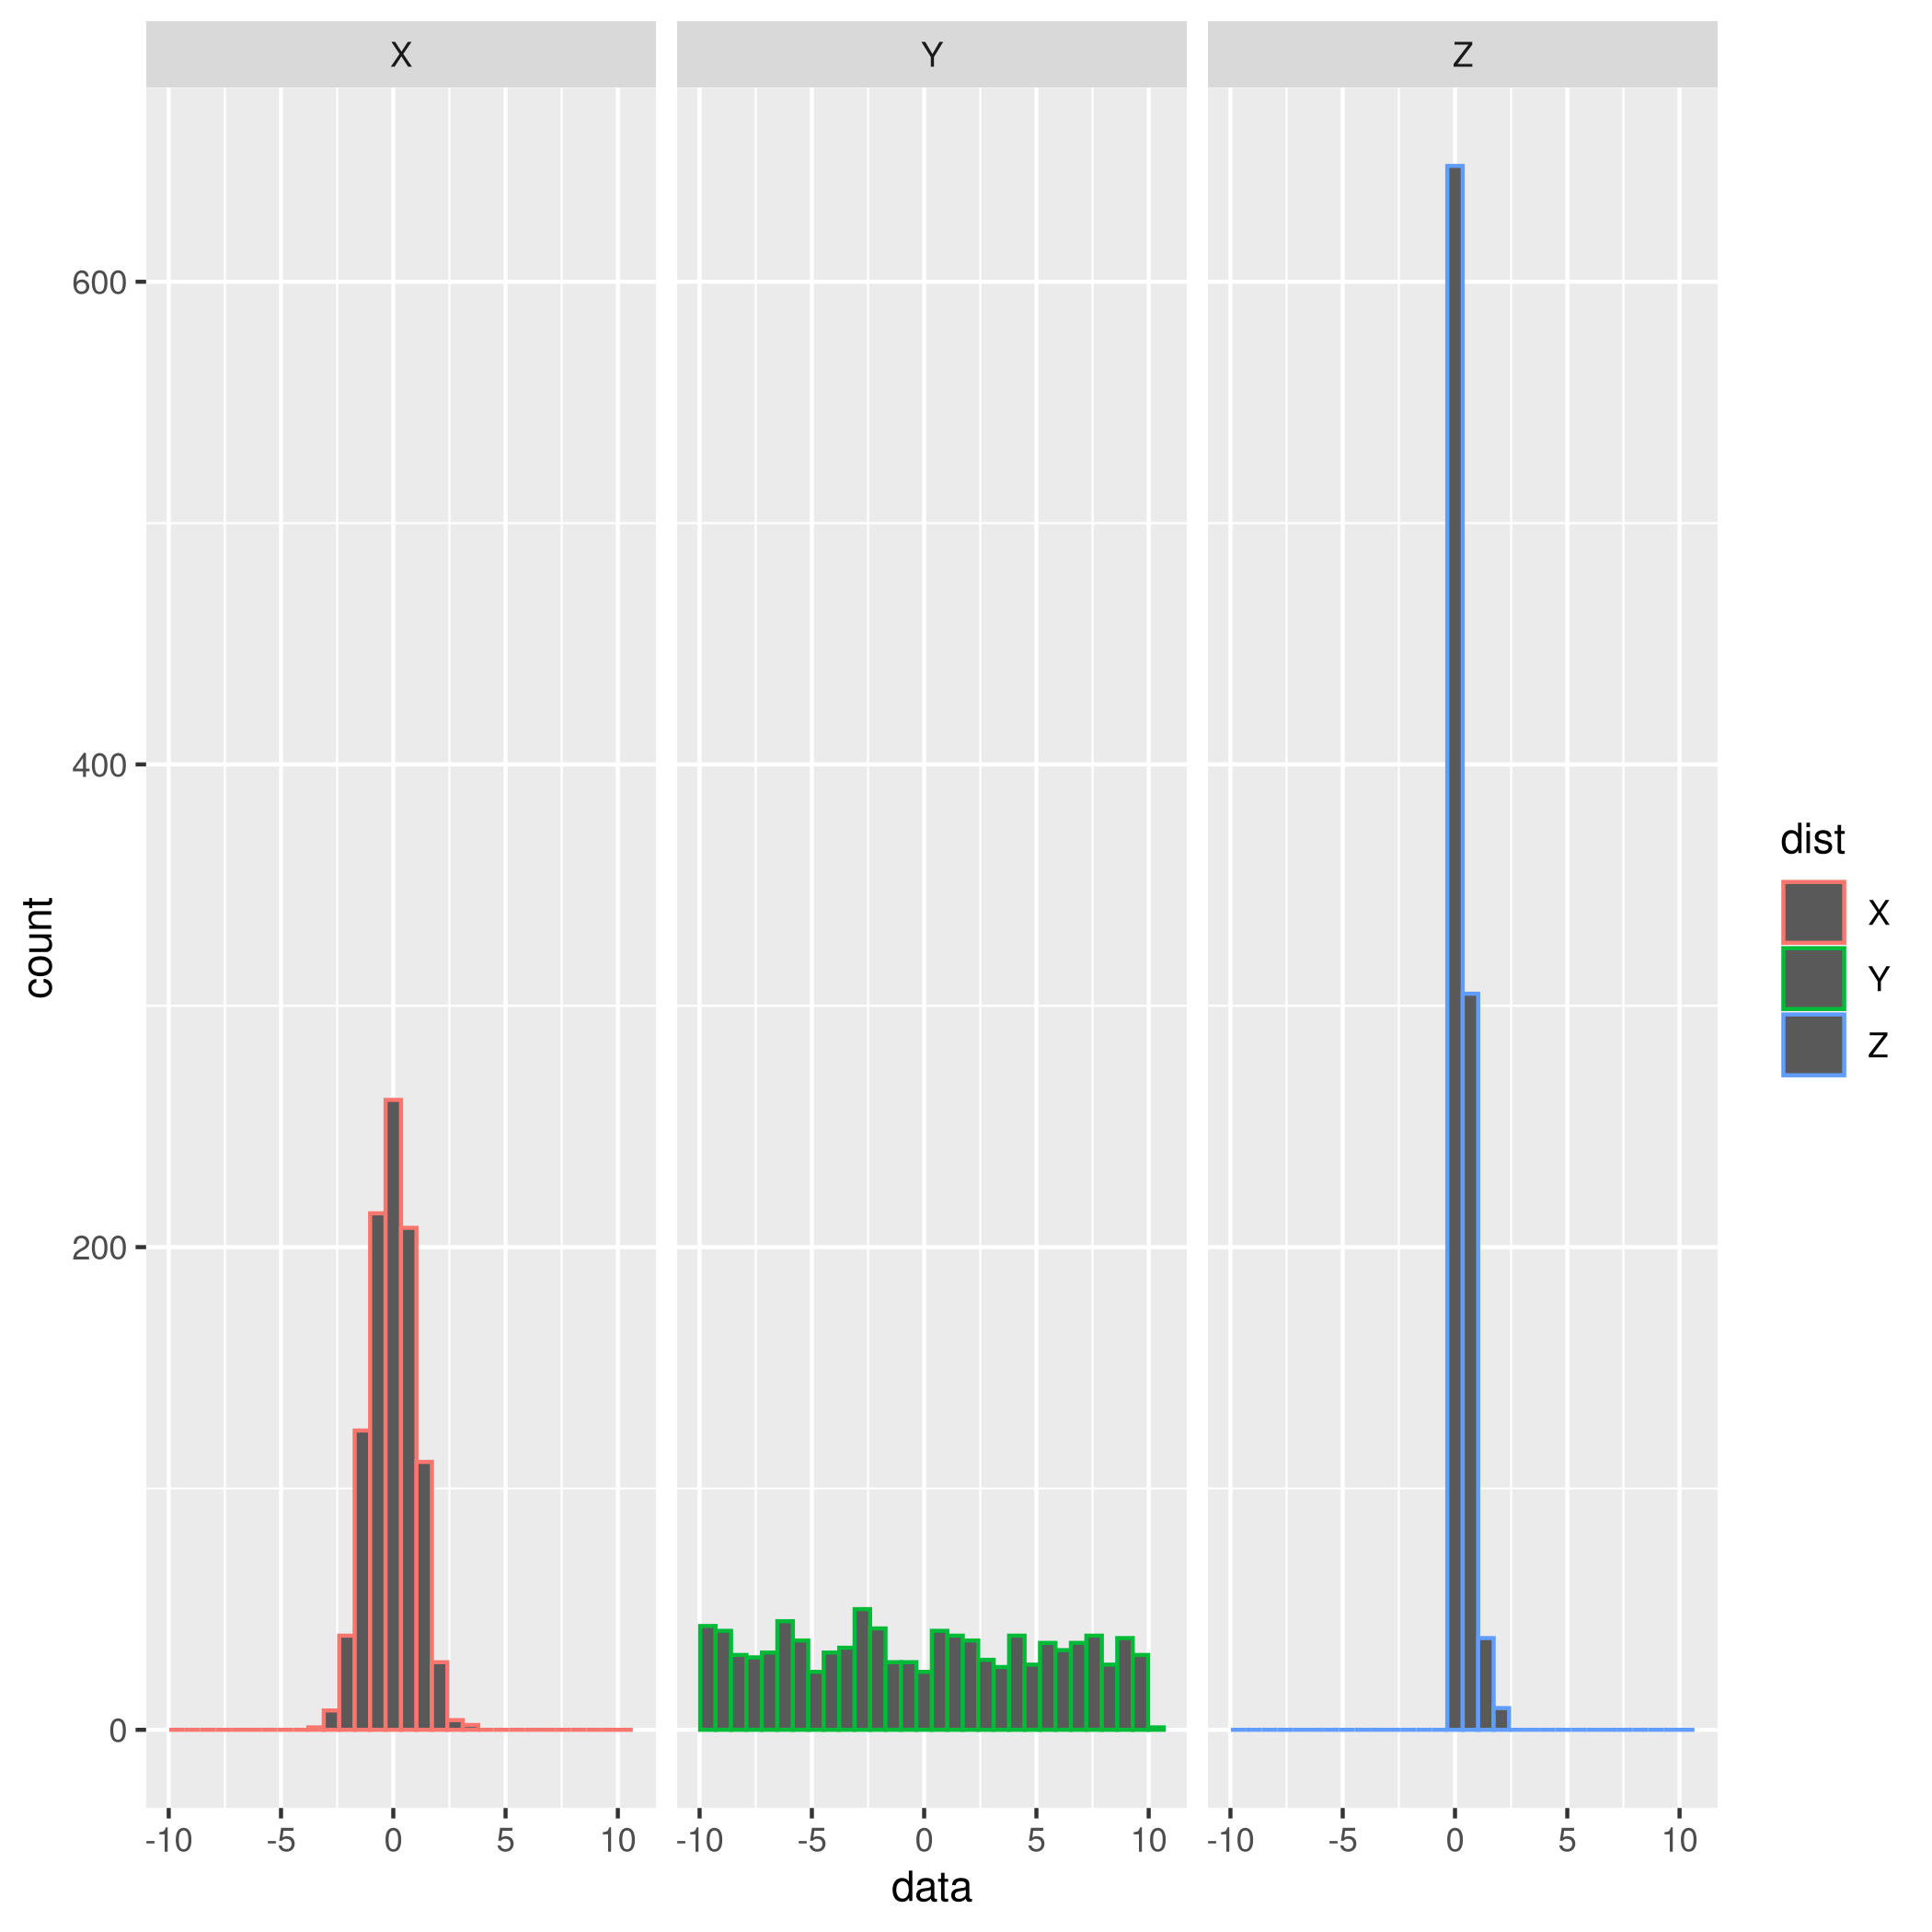
- The y-axis captures counts, and gives us no indication of the magnitude of the observed variables
- The x-axis shows the ranges of values that observations of X, Y, and Z fall into